


Executive Summary
The company being discussed has the following characteristics:
- Revenues have gone up 4X+ in the last 8 years
- PAT has gone up 2.5X in the last 8 years
- Operating Cash Flow has followed PAT in a similar proportion. Free Cash Flow has also followed the trajectory of PAT (though it is not perfectly correlated as one would expect).
The initial view would be that the company has strong momentum. Of course, the above doesn’t tell us anything about the attractiveness of the stock. So I supply the following:
- Stock trades at a multiple of 7X trailing earnings of Fiscal Year (FY) 2017
- EV/EBIT multiple is 4.2X of FY 17 EBIT.
As a blue-blooded investor, you chuckle and say, “Aha! Of course, the stock is a value trap. Management doesn’t return anything to the shareholders and markets reciprocate by giving lower multiple.” Below is management’s track record on returning cash:
- Management has continuously returned cash to shareholders.
- In the last 8 years (since it went for IPO in Feb 2010), the company has returned Rs 3,200Mn to the shareholders. In contrast, the company raised Rs 1,900Mn in 2010 through IPO. Since then the company has not raised any additional capital. IPO in 2010 was oversubscribed 41x and the company IPO was among the most successful IPOs of the year
As you wonder what else could be wrong, you come up with, “Of course what has happened in the past is history and the stock market values a stock based on future expectations. What can we say about the prospects?” Here are the details:
- In FY 18 (April 2017 to March 2018), management expects to grow revenue by 20-25% and margin by 8-10%. Since half the fiscal year is already over, we feel that the company should be able to deliver on those expectations.
- Company is in IT Services business. IT services have faced headwinds from increased automation, visa challenges, commoditization of business, and rupee appreciation. We will talk more about the company’s business and prospects in the detailed write-up that follows.
Management doesn’t provide long-term guidance. Of course, management can promise the moon and not deliver on it. So it is important to know more about the management:
- Sanjay Govil: Sanjay started Infinite in 1999. Sanjay is a graduate of Auburn University and Syracuse University besides being a fellow of Wharton School of Business. Sanjay owns 75% of the company.
- Upinder Zutshi: Upinder is the MD & CEO of the company. Upinder graduated from BITS Pilani and has been in IT services for 30+ years (with Infinite for 15+ years). Upinder owns 3%+ of the company.
I hope the above summary whets your appetite to read the rest of the write-up.
Company Background
Infinite was founded in 1999. Today it is a publicly-listed entity headquartered in Bangalore, India. It has a presence across three continents and services 150+ clients.
Unlike other companies, Infinite has focused on working closely with a few companies and being their trusted partner. Thus Infinite has a very long-standing relationship with many of its clients. This is best reflected by one of the slides from the company’s presentation.
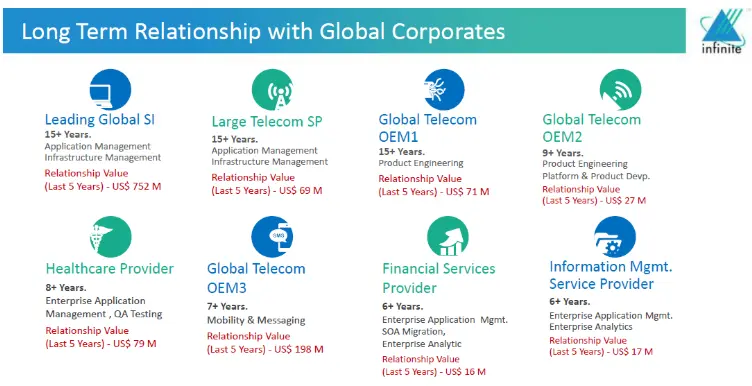
Some of the relationships go as far back as 15 years while many of them have been clients for 5+ years. This shows that Infinite provides services that its clients find valuable.
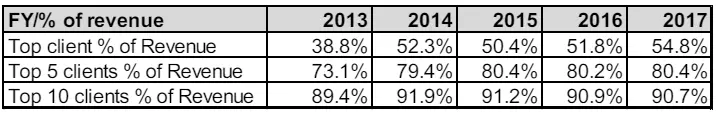
The above strategy causes significant concentration of revenue from its top clients. This is one of the risk factors in investing in this company. We will discuss more about this risk factor in the subsequent sections.
Business Segments
Company offerings can be best analyzed by looking at the 3 business segments that the company focuses on:
- Technology Solutions
- Mobility Solutions
- Product Engineering Services
Technology Solutions
This business segment is comparable to the solution that other IT services firms in India provide. The company focuses on Projects for clients, Support and Maintenance of various applications, Infrastructure management, and IP-based solutions (through in-house products and platforms).
The company uses these in-house products and platforms to reduce the turnaround time for its clients. Zyter, a product launched last year, has seen increased traction in the Healthcare provider domain. Zyter has enabled Infinite to win EMR (Electronic Medical Record) migration and cloud migration of healthcare applications from some of the prestigious hospitals.
The company is a major contractor for IBM (its top client). In the recent consolidation of vendors by IBM, Infinite was among the 4 vendors that were chosen to do contractual work for IBM globally. This win from IBM has translated into significant traction in new revenue in FY 18. Contract revenue from IBM has a low EBITDA margin % and hence overall company margin in % terms will decline further in FY 18. However, the company only takes work from IBM which increases the absolute amount of margin (doesn’t do any work at a loss). Hence the margin (in absolute terms) should increase in FY 18.
Mobility Solutions
This segment was formed in 2010 when Infinite allied with Nokia (erstwhile Motorola). It provides messaging and mobility solutions to carriers and enterprises. In the past, most of the revenue was coming from the SMS gateway and upgrading of this gateway for new usages.
The company has continuously been introducing new products to keep up with the evolution of the messaging space. The company had significant hope from RCS (Rich Communication Suite) in 2014-16 which didn’t pan out as expected. However, some of the new messaging platforms like EMS (Enterprise Messaging Services) and Netsfere (WhatsApp for enterprises) are seeing good traction. The company now has more than 100 clients in this segment.
As the company’s products get better acceptance in the enterprise, this segment has the potential to provide non-linear growth on both revenue and margin front.
Product Engineering Services
This segment was introduced after the acquisition of Comnet International in 2007. It provides hardware and software support to customers in the Telecom and Industrial Control & Automation segments along with full life cycle support for products, platforms, and systems.
This segment leverages IP IP-based revenue share model with its customers. The company’s expertise in components that enable the Internet of Things (IoT) could position it as a compelling IoT solution provider in the future.
We don’t have enough clarity on this segment to have a strong view of its contribution to the overall growth of the company.
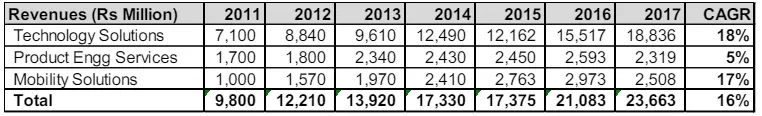
Overall
The below table shows how the company revenue has grown in each of the 3 segments over the last 7 years. We believe that the biggest potential for the company continues to be in the Technology Solutions and Mobility Solutions space for the following reasons:
- Within the Technology Solutions segment, the company has created specific platforms for various domains. These platforms enable reuse thus reducing both cost to client and time to market.
- The company’s products in the Mobility Solutions segment are getting to a critical mass of adoption by enterprises. If these early adopters realize the expected benefit, it can trigger the next wave of enterprises to adopt these products.
Company’s Financials
Let us now review some of the key metrics of the company by reviewing the 3 financial statements.
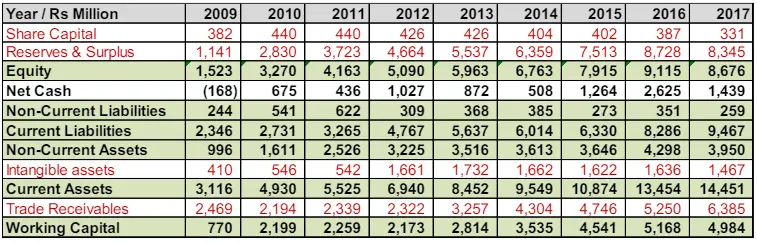
Balance Sheet
Below is an abbreviated Balance Sheet statement to highlight some interesting observations:
Share Capital: The share count went up in FY 2010 when the company did an IPO. Since then
- the company has done 4 buybacks in FY 2012, 2014, 2016, and 2017. The share count at the end of FY 2017 is lower than what it was pre-IPO in FY 2009.
- Net Cash: This reflects cash, net of debt. From a net debt company in 2009, the company has become a net cash company. The company has plowed the cash generated into buying back shares as reflected by a reduction in share capital.
- Intangible Assets: The company started focusing on new products in FY 2012 and initially capitalized on the cost of these products. However, starting in FY 2014 Company started expensing all product expenses. In addition, its P&L has borne the cost of amortizing past capitalized products. The impact of these is one of the reasons for lower margins in subsequent years.
- Trade Receivables: The company has very high trade receivables. One of the contributors to high receivables is the contract work from IBM. It is fair to assume that high capital intensity (and corresponding lower return on capital) is an aspect of the firm’s business model.
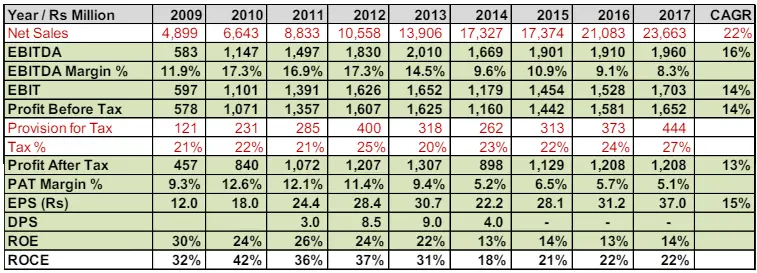
Profit and Loss
Below is an abbreviated Profit and Loss statement to highlight some interesting observations:
- Sales: Sales have grown by 22% over the last 8 years. Management is determined to grow sales at a fast pace to graduate from being a small player in IT services.
- Margin % – both EBIDTA and PAT: Margin % have come down dramatically after FY 2013. This reduction in margin is due to multiple factors:
- As discussed in the Balance Sheet section, the company started expensing investments in products from FY 14 onwards. This has reduced the margins.
- The company accelerated investments in sales to continue to grow its revenue.
- The company focused on creating platforms for specific domains. This was done to better differentiate the company from its competitors. All costs related to building these platforms were expensed.
- Some of the top 10 clients moved their business elsewhere. This lost business was a high-margin business thus reducing the margin of the remaining business.
- ROE: Lower margins have translated into lower profitability and ROE.
- DPS: The Company has done away with dividends since FY 2015. Co is now returning value to shareholders through buybacks which is tax efficient.
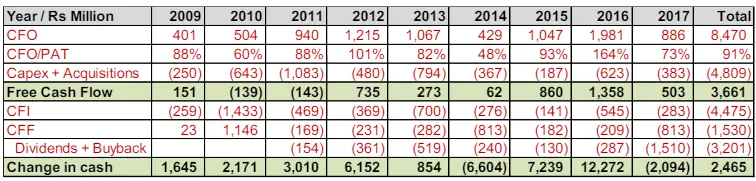
Cash Flow
Below is an abbreviated Cash Flow statement to highlight some interesting observations:
- CFO (Cash Flow from Operations) / PAT (Profit After Tax): This ratio is 91% reflecting good conversion of profitability into cash flow.
- Free Cash Flow: In the last three years FCF has averaged 900Mn. We expect that FCF will grow an average of Rs 1,000Mn over the next three years.
- Dividends + Buyback: The company has returned Rs 3,201 Mn since its IPO. This is significantly higher than the money raised in its IPO.
Overall
Here are the key takeaways from the financials:
- Revenues have grown at 20%+ since the company’s IPO.
- However, PAT has grown at a lower 13% CAGR as the company has invested in products and platforms to better differentiate its offering. This coupled with growth in contract work from IBM has caused both EBIDTA and PAT margins to fall below the industry margins.
- The company has generated significant FCF which has been used for rewarding shareholders through dividends and buybacks. Buybacks have been done at very good prices resulting in a significant reduction in several outstanding shares (outstanding shares are now below its pre-IPO level).
- High working capital intensity (due to high trade receivables) causes significant capital to be tied up in working capital. This has lowered ROE for the company.
Management
Management is a critical factor in the success of any investment. In an industry like IT services where people are the key asset, having the right management makes all the difference to the success of the thesis.
Background
Sanjay Govil: Sanjay is the Chairman of BOD of Infinite. He founded Infinite in 1999. Sanjay did his bachelor’s from Auburn University and master’s from Syracuse University. Before starting Infinite, he worked at IBM and Verizon Communications. Interestingly both of those companies were early clients of Infinite. Sanjay was the winner of the E&Y Entrepreneur of the Year award in 2002.
From our conversations in the industry, we are led to believe that Sanjay is extremely committed to Infinite. He is very passionate about the new products/platforms the company is building and sees a bright future for the company. Sanjay owns 75% of the company and has put his money where his mouth is. In the past, Sanjay has bought aggressively from the market but now he can’t go above the SEBI mandated 75%.
Upinder Zutshi: Upinder is Managing Director & CEO of Infinite. Upinder has been with Infinite for 15+ years. Upinder graduated from BITS Pilani and has worked in IT services since.
In our interactions with Upinder, he is very optimistic about Infinite (as one would expect of a CEO). His optimism is based on the traction the company has in the healthcare domain as well as the adoption of new products like Zyter, Netsfere, and EMS by enterprises. Upinder owns 3%+ of the company and has the right incentives if the company does well.
Management Action
While good pedigree and nice intentions are wonderful, it is the actions that count. Infinite’s management has walked the talk as some of the below actions demonstrate:
- Sanjay Govil’s stake in Infinite went above 75% (maximum ownership as mandated by SEBI) after the company’s buyback of shares in FY 17. Our experience in such situations is that most owners reduce their stake through Offer for Sale. However, Sanjay distributed the excess ownership above 75% through a bonus offer to the rest of the shareholders. Thus effectively he gave away his excess shareholding to the rest of the shareholders at no cost!
- Management has done 4 buybacks in the last 8 years since its IPO. They have returned more money than they have taken in during the IPO. Management remains committed to creating shareholder value by being very demanding with any acquisition opportunity. In the interim, they realize that their stock is the best value and have been using excess cash to buy back their stock.
- The company’s compensation to its leadership team and ESOP to its employees have been reasonable.
Overall
Management has been shareholder friendly and their significant stake in the company gives us the confidence that it will continue on this “enlightened path.”
Valuation
We can value Infinite in a few different ways.
Future Projection
In this method, we will take current earnings, project it out for a few years, and then apply reasonable multiples.
PAT projection
- FY 2017 PAT of Rs 1,200 Mn has been stuck in a similar range for the last 5-6 years.
- However, as discussed in the write-up, PAT has not grown as the company has invested in building out its capability.
- For FY 18, management is projecting margins to grow by 8-10%.
- Given traction with mobility solutions and technology solutions, it is reasonable to assume that the company can deliver a PAT CAGR of 8% over the next 3 years. Thus FY 20 PAT is expected to be Rs 1,510 Mn.
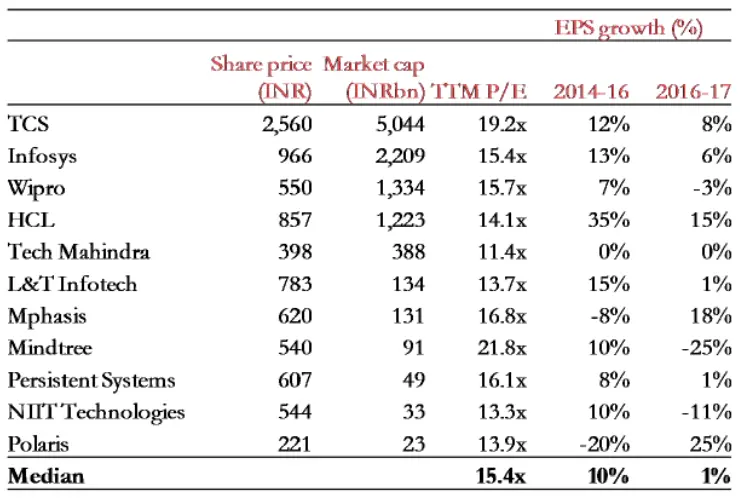
- Applying a multiple of 10X earnings (see the below table for earnings multiple and growth rates of some of the other IT services firms. It is quite obvious that we are being very conservative with our multiples), the market value would be 15,100Mn.
EBIT projection
- FY 2017 EBIT of Rs 1,703 Mn is the highest the company has ever achieved.
- Management has projected that margins will grow by 8-10% in FY 18. By taking the lower of this range and extrapolating 8% CAGR in EBIT till FY 2020, we get EBIT of 2,145Mn in FY 20.
- Since the tax rate is around 27%, we will apply EV (Enterprise Value) to an EBIT multiple of 7X (compared to 10X for earnings). So EV would be 15,017Mn.
- We assume that the company’s cash position as of FY 17 remains unchanged in FY 20. This implies that all the FCF cash generated for 3 years (FY 17-20) is returned to the shareholders through buyback. So MV=15,017 + 1,439Mn = 16,456Mn in FY 20.
Share count projection
- We expect that the company will generate FCF of 1,000Mn a year on average or 3,000Mn over the next 3 years.
- We expect that management will return this FCF to shareholders as they don’t need additional cash in the business. We expect that the company will be able to do 2 buybacks – early FY 19 and late FY 20.
- If these 2 buybacks are done at an average price of 375/sh, share count will reduce by 8Mn from 33Mn to 25Mn. (Buyback in FY 17 of 1,500Mn was done @265/share and reduced the share count of the company by 5.7Mn).
Overall
- Averaging MV from the 2 techniques above gives a Market Value of 15,775Mn.
- Using a share count of 25Mn gives an expected price of 631/share by June 2020. This gives us a forward return of 40% CAGR in the next 2.6 years.
Intrinsic Value
In this method, we assume that we show up as a private buyer of the company today. Here are some of the things that we will consider in valuing the company:
- FCF of the company is expected to be around 1,000Mn for the next few years. We further assume that the company’s FCF doesn’t grow and remains stuck at this level to perpetuity. In addition, we discount this FCF at 15% (others can discount at discount rates that make sense to them), and we get a valuation of 1,000Mn/15% = 6,667Mn for the FCF.
- The company’s net cash on its book has gone up to 2,690Mn as of Q2, FY 18.
- The company has 5,000Mn working capital tied up. Given the business model requires a high intensity of Working Capital we will assume that none of this working capital can be released. All of it is required for the smooth running of the business. Hence we don’t assign any value to this.
- The company has investment in property assets to the tune of around 1,000Mn. These were thought of as “safe” investments. If management can be faulted for anything, it is their extremely conservative way of managing their affairs including investment in real estate!
- The company’s headquarters in Bangalore is carried on its Balance sheet at a significant discount to its current market value. Estimates of the market value of this property range from 2,500Mn to 4,000Mn. We take the lower range of 2,500Mn.
- If the company headquarters in Bangalore is sold, there will be an ongoing expense of leasing another office for its Bangalore employees. We conservatively estimate the discounted PV of this cost to be around 1,000Mn.
| In Millions | |
| Discounted value of FCF | 6,667 |
| Net Cash | 2,690 |
| Investments in property | 1,000 |
| Value of headquarters | 2,500 |
| Leased office expense | (1,000) |
| Total | 11,857 |
- Doing the sum of parts of the above and ignoring the rest of the assets we get 11,857Mn = 359/share or almost a 38% premium to its current valuation.
Overall
- Company is a fantastic bargain from both a Future projection and an Intrinsic Value perspective.
- We expect the company’s stock to be worth 631/share by June 2020 providing us a 40%+ CAGR over the next 2.6 years.
- Alternatively, a private buyer can buy the company today for 359/share and the buyer still would have got a fantastic price.
- The above valuations don’t account for some of the unknowns that could enhance the value of the company significantly. These include:
- Traction in company’s products like Zyter, Netsfere, and EMS. Traction in these products can change the margin profile of the company in a very significant manner.
- The company recently did another deal on similar lines as what was done with Motorola in 2010. Motorola’s deal enabled the company to start a new segment and provide stable cash flows over almost a decade. This new deal would have the additional benefit of leveraging synergies with the existing infrastructure from the Motorola deal.
- Lastly, the company is seeing increased traction in the healthcare space. The company is currently working with many providers (hospitals) and helping them with EMR (Electronic Medical Record), usage of the cloud, and newer technologies. Their recent deal with the Department of Defense to conduct medical disability tests can open up another stable stream of revenue and margins. Besides, this deal could put them in the running for many similar deals.
- This is a classic, “Heads I win, Tails I don’t lose much.”
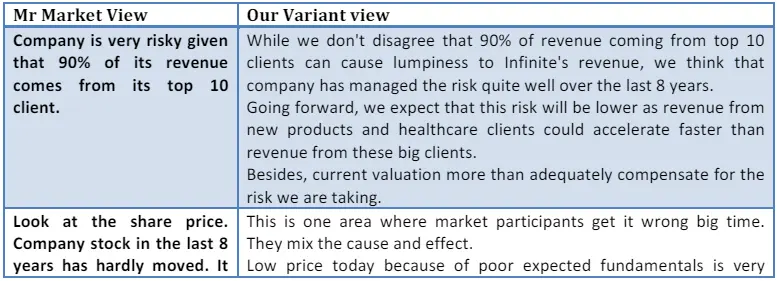
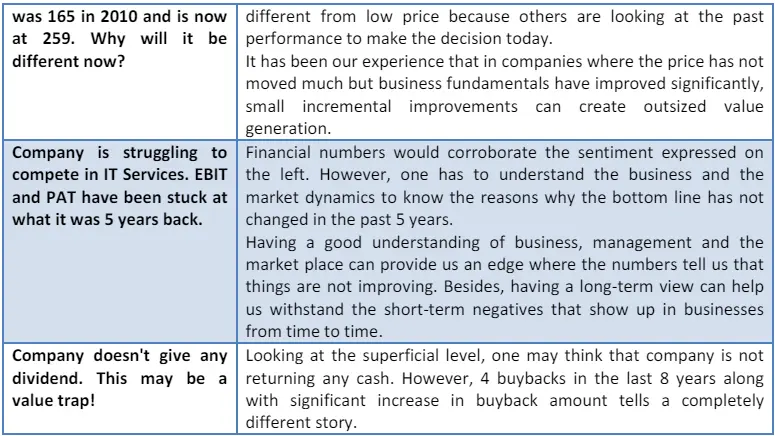
Variant View
In this section, we outline some of the reasons why Mr. Market is underpricing this company. We then provide our variant view of the same. This section has been put in the thesis to follow Charlie Munger’s dictum, “I never allow myself to have an opinion on anything that I don’t know the other side’s argument better than they do.”
While we don’t claim that we know the other side of the argument better than the next person, we sure as hell do try.
Trade Feasibility / Idea Practicality
The company’s market capitalization is $ 130 million. Thus this idea could be a good fit when the portfolio is looking at investing under $ 10 million in an investment opportunity. Infinite is listed on both the NSE (National Stock Exchange) and BSE (Bombay Stock Exchange). Additional details are provided in the table below:
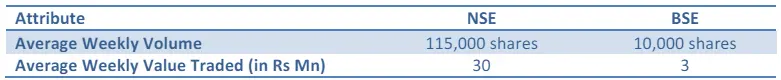
Our experience is that one can buy 15-25% of the weekly traded value without disturbing the price too much. Investors who are keen to build a few $Million positions should be able to do it in a few months. However, given limited liquidity, they should be thinking for the long term to get the best out of this idea.
Risks with the thesis
Some of the key risks with the thesis include:
Loss of a significant client
Infinite top 10 clients account for 90% of its revenue. Any loss among the top 10 clients creates a big shortfall in revenue. Losing clients in the top 10 was one of the reasons why Infinite margins went down significantly in the 2013-15 period and have stayed down since.
Infinite is aware of the risk and has tried to mitigate it by working with more clients. However, the initial contribution from these new clients is still minuscule.
Technology changes and adaptability
The thesis is predicated on the fact that Infinite will continue to be able to adapt to the changing technology landscape. They have done this for the last 18 years but the accelerating pace of change and automation may put additional pressure on their margins.
Our view is that management has shown the foresight to make tough decisions when required. The company took a hit on margins but invested significantly in products and platforms to differentiate its offering. We think that management is committed to managing the company for the long term even at the cost of short-term results.
Ability to work in the Americas
Infinite derives around 90% of its revenues from the Americas. Anything that reduces its ability to work with its Americas client can have a significant impact on the company’s performance. While the company has claimed that H-1 visa restrictions are a non-event for the company, employee costs have been trending up.
Infinite will have to balance its cost structure with the need to continue to serve its key geography. The first 2 quarters in FY 18 have had headwinds. However, management has indicated that that was a conscious strategy to show initial benefit to some of the new clients before employee costs go back to their normal level.
Disclaimer / Disclosure
- It is safe to assume that DoorDarshi Value Advisors (DVA) and its employees/partners/clients have a position in the stock discussed.
- The stock discussed was for illustration purposes only and not to be construed as investment advice.
- Please do your due diligence and consult your advisor before acting on it.
- Neither DVA nor its employees/partners have had actual/beneficial ownership of one percent or more at any point so far.
- Neither DVA nor its employees/partners have any other material conflict of interest at the time of publication of the research report.
- Neither DVA nor its employees/partners have received any compensation from the subject company in the past twelve months.
- Neither DVA nor its employees/partners have managed or co-managed a public offering of securities for the subject company in the past twelve months.
- Neither DVA nor its employees/partners have received any compensation for investment banking merchant banking or brokerage services from the subject company in the past twelve months.
- Neither DVA nor its employees/partners have received any compensation for products or services other than investment banking merchant banking or brokerage services from the subject company in the past twelve months.
- Neither DVA nor its employees/partners have received any compensation from the subject company or any third party in connection with the research report.
- None of the employees/partners of DVA have ever served as an officer, director, or employee of the subject company.
- Neither DVA nor its employees/partners have ever been engaged in market-making activity for the subject company.